Making your JITted Code known: Let me count the ways

AOT Compilers
It has been normal and expected for a long long time that any machine code they spit out would come with a bunch of metadata that is meant to be used by different pieces of the target system.
There is of course symbol names for functions, which allow you to use the instruction pointer to find what the function it's currently in is called, and where it starts. Plus, when a dynamic library (a DLL, dylib, or so) is loaded, the symbol names are a part of what allows you to actually call the functions that you want.
There's the debug data, which can include a wide variety of things. The interesting parts for this post are line number annotations that you can use to take the instruction pointer and not only get the name of the function it belongs to, but also the file name and line number (and more).
For languages like C++ that have exceptions, there is tables with the necessary information to find out at run time when an exception is thrown, how each of the frames on the stack want to deal with it. Of course this includes checking if there is a try block in the function that covers where inside the function the instruction pointer currently sits.
In the process of handling exceptions, it is typically necessary to get rid of some amount of stack frames, as if the code had returned from these functions. This is called "stack unwinding".
You don't want to compile special code into every function to handle the possibly quite rare case that an exception passes it by. In order to support unwinding frames, the run time library will read data put into the program by the compiler that tells it exactly what needs to happen to properly get rid of the stack frame, depending on where exactly the instruction pointer is.
"Getting rid of the stack frame" also includes things like freeing different kinds of resources. This should be familiar to any C++ programmer, where you can have local variables that are cleaned up automatically when execution leaves the scope in which it is valid.
But MoarVM, which I haven't told you yet this post is about, is written in C and even though the Raku (and nqp) code it runs has exceptions, Raku exceptions are basically unrelated to the C stack. Why, then, am I talking about exceptions and stack unwinding tables?
The reason why I know more than the most surface details is that something related to this broke suddenly when MoarVM was compiled on Windows starting at a specific version of MSVC.
The reason why that can happen in a project written in C, which doesn't have exceptions like C++ does, is that we do use longjmp for "basically exception handling, but with only one bell, and no whistles":
When the implementation of some opcode encounters a problem ("the specified attribute doesn't exist", "wrong type for this kind of op", etc etc) we can just call the function MVM_exception_throw_adhoc with a string and we jump from however deep in the C stack we may be back to the interpreter loop where we translate the exception into the kind of exception that Raku works with.
The change that caused this to explode was that on Windows, the implementation of longjmp changed so that it always tries to fully unwind the stack frame-by-frame. For C code it would otherwise be possible to do the entire unwinding process by just changing the stack pointer to what it was at the point setjmp was used. After all, C doesn't have per-frame / per-function cleanup.
This wouldn't be a problem, since the compiler could just emit all the unwinding data for everything. Except that MoarVM also has a JIT compiler. The JIT compiled code usually calls into the same implementation functions that the interpreter itself would use, so a frame from JITted code may be on the stack at the time longjmp happens, and we didn't have anything in the JIT compiler to provide the necessary data to allow Microsoft's implementation of longjmp to handle these, causing a crash at run time.
"Oops"
I started working on code to provide the necessary data, since the WinAPI offers functions for exactly this purpose. I had difficulties doing development on the free Windows VM that you can get from Microsoft, so it was a bit of a painful process, and a fix that takes a whole lot less code came to the rescue. You can still look at the code I wrote to generate unwinding information for our JITted code and registering it with the WinAPI function RtlAddFunctionTable here in my MoarVM pull request.
The simpler fix we ended up going with, including a lengthy explanation of the problem and solution, can be found in this pull request from Patrick Böker, with thanks to Lazymio for this post from the Unicorn Devblog.
But this was an important step on my journey towards the main topic of this post:
What are the ways our JIT compiler can tell other parts of the system (including not just the OS, but also development tools such as profilers and debuggers) information about the code it spits out?
Quick Overview
APIs I've already come across and done something with:
RtlAddFunctionTablelets you give unwinding info to the WinAPI and its consumers, including where a jitted function starts, but doesn't let you give it a name.- libunwind's
_U_dyn_registerlets you give a function a name and provide a table of unwind instructions. - GDB's "JIT Debug Info Readers" let you give arbitrary information to GDB, but is very "manual".
- The
JITDUMPformat is meant to be used with Linux's "perf" tool. It lets you give a function name, an unwind table, and even line number annotations! It requires a post-processing step though. - "Perf Map" is a simple text file placed at a predictable position in the filesystem with one line per jitted function, the address in memory and its length, as well as its name.
There's also techniques I've seen but haven't myself tried yet. The first thing that comes to mind is to create a full ELF file (or DLL on windows or dylib on macos), write it to disk, then load it with dlopen.
There's also one thing I wish was there but I couldn't find a way to have it yet. I'll show you at the very end of the post!
Quick and Simple: Perf Map
The simplest out of all of these by far is the "Perf Map". We've had support for this in MoarVM going back to September of 2018. It allows you to see the names of functions and the filename they are associated with in the "report" output from the perf tool, and presumably some other profiling tools can consume this format as well.
The main drawback of this is that perf at least won't be able to let you look at the assembly of these functions. I assume this is because there's nothing that keeps the machine code around.
Exhaustive and Exhausting: Complete loadable shared object
On the other end of the simplicity scale sits creating loadable dynamic library files and loading them into the process. It's also the only approach out of these that I could imagine probably works fine with every external tool. You just have to be fine with keeping the files around until the moment your tool needs them. After all, libraries aren't meant to disappear forever after the program has finished. Also, it feels like a lot of boring work to write a correct ELF (plus whatever your other target platforms want) file essentially by hand (of course you could use all the struct definition), and doing a round-trip to the filesystem feels like it might incur a heavy performance penalty. I haven't tried it though!
For All Your Unwinding Needs: RtlAddFunctionTable and _U_dyn_register
The next approach I will describe is using RtlAddFunctionTable or libunwind's _U_dyn_register, which are very similar. If I remember correctly, I didn't actually get RtlAddFunctionTable to work, and I'm not sure what exactly I was missing. I think it might have been related to address spaces, offsets, and stuff. It is however very similar to how _U_dyn_register works. The latter only works if you want to walk stack frames in your own program for whatever reason. I didn't see anything that can just piggy-back on libunwind's internal data structures to use the data for other purposes. If you want, you can compare the RtlAddFunctionTable implementation I linked above with the commit that has the equivalent thing in it.
Lots of Power, Lots of Work: GDB Jitreader
Now we will take a look at GDB's "jitreader" feature. Essentially, there is a symbol called __jit_debug_descriptor that GDB will look at whenever you call a function called __jit_debug_register_code (which is otherwise empty). It points at a doubly-linked list with addresses and sizes of "symfiles". You can make up your own definition of what is actually stored at the address, since you will have to implement the code to interpret the data at this address yourself. That's because the second half of the jitreader feature is a dynamic library that you load into gdb itself. When you tell it to load the jitreader, GDB will run the gdb_init_reader function in your plugin and expects you to give it implementations of a few functions, including a function to read the debug info. GDB passes you a struct full of function pointers including one to read bytes from the target process, and functions that let you create an "object", a "symtab", a "block" inside a symtab, and adding a "line mapping" to your object. Here's a link to where I use these functions to introduce jitted functions to GDB. It has been over a year since I last touched this code, so I'm not exactly certain of the details, like "do the line mappings actually work as expected?", and I certainly can't vouch for any of this code being correct. But it does put jitted code with name, filename, and line number in backtraces, like this:
#6  0x00007ffff746a483 in MVM_io_write_bytes (tc=0x5dd68020180, oshandle=<optimized out>, buffer=<optimized out>)
   at src/io/io.c:178
#7  0x00007ffff575cb3e in spurt () at SETTING::src/core.c/IO/Handle.rakumod:7
#8  0x00007ffff7428d26 in MVM_interp_run (tc=<optimized out>, initial_invoke=<optimized out>,
   initial_invoke@entry=0x7ffff7561080 <toplevel_initial_invoke>, invoke_data=<optimized out>,
   outer_runloop=<optimized out>, outer_runloop@entry=0x0) at src/core/interp.c:6459
The perhaps roughest part was maybe writing the unwind function. The jitted code we spit out adheres to the x64 SYSV ABI (on linux, that is) including the frame pointer being at the expected place. I didn't see an obvious way to just have GDB do the default unwinding, so I implemented restoring all the relevant registers of the previous frame by hand with the functions GDB gave me. Not using push and pop opcodes in our JIT has the benefit that no matter where the Instruction Pointer lands, exccpt right at the very first few instructions, the steps to unwind the frame are the same.
If you have more questions, such as what other interesting information you can put into the debug info that the program "sends" to GDB, or what else you can do when GDB encounters one of your jitted frames, you may have better luck reading the GDB documentation yourself ... It is sadly rather sparse on the topic of the jit reader API but on the topic of extending GDB with Python (which is the route I have chosen to make MoarVM easier to debug) there is much more to see. GDB being a GNU project, you will not be surprised to learn that another way to extend it is to use Guile Scheme, which I myself have not tried before.
I could have sworn I had a WIP / PoC for using the GDB Python API using Frame Filters and DisassembleInfo to show much more information for disassembled JIT code, but for the life of me I can't find it any more ...
If you find this interesting, let me recommend this blog post that Max Bernstein wrote about the GDB Jit Interface including an explanation of how you used to have to create a full shared object in memory to have GDB understand your jitted functions, a few implementations of that version of the interface, and how the new "jitreader" plugin approach allows you to do it more easily, and finally a jitreader plugin that just reads Perf Map files.
Finally, Something to Behold: JITDUMP
Even though this post is already quite lengthy, I'm going to spill a bunch more ink for the API that took me the furthest so far in my journey to debug and profile jitted code on a fine-grained level: The JITDUMP format.
Here's the official specification of the JITDUMP format in the linux kernel's perf folder. If you want to follow along, here's a/the Pull Request on github that puts JITDUMP support into MoarVM. Here's also a blog post that helped me get started, which shows how to write JITDUMP files in rust.
The long and short of it is this: Your process opens a file in whatever place you find convenient (new files will later be created next to it, so a freshly created folder is a good choice). You mmap it executable as a kind of "signal" or "marker" event, and you write the monotonic clock value at that moment into the header. Then you can write variable-sized blocks of data every time your jit does something specific, like finalizing a blob of machine code at a given location, again with the monotonic clock timestamp. Maybe the most important piece of the puzzle is that when adding such a blob of machine code to the file, you also have to include the entirety of the machine code in the file. I guess this is what makes it the jit "dump" file!
Later on, a perf recording of your process execution (with -k 1 to choose the same monotonic clock as the time source used in the recording) can be enhanced with the separate perf inject tool. This tool can do a few tasks, but the one we're interested in is the one that the --jit flag controls: Feed it your jitdump file, pass your perf.data as the input and something like perf.jit.data as the output filename and perf inject will create an entire .so file for each of the jitted frames, and using the timestamps from the jitdump file to cross-reference when each frame becomes available (or unavailable again) somehow stores the connection between raw memory address during runtime to actual jitted function inside a .so file.
After all of this work, we can finally open a regular perf report, go into one of our jitted frames, and finally be presented with disassembly, just as if the jitted function had been an AOT-compiled function the entire time! (But probably not as thoroughly optimized).
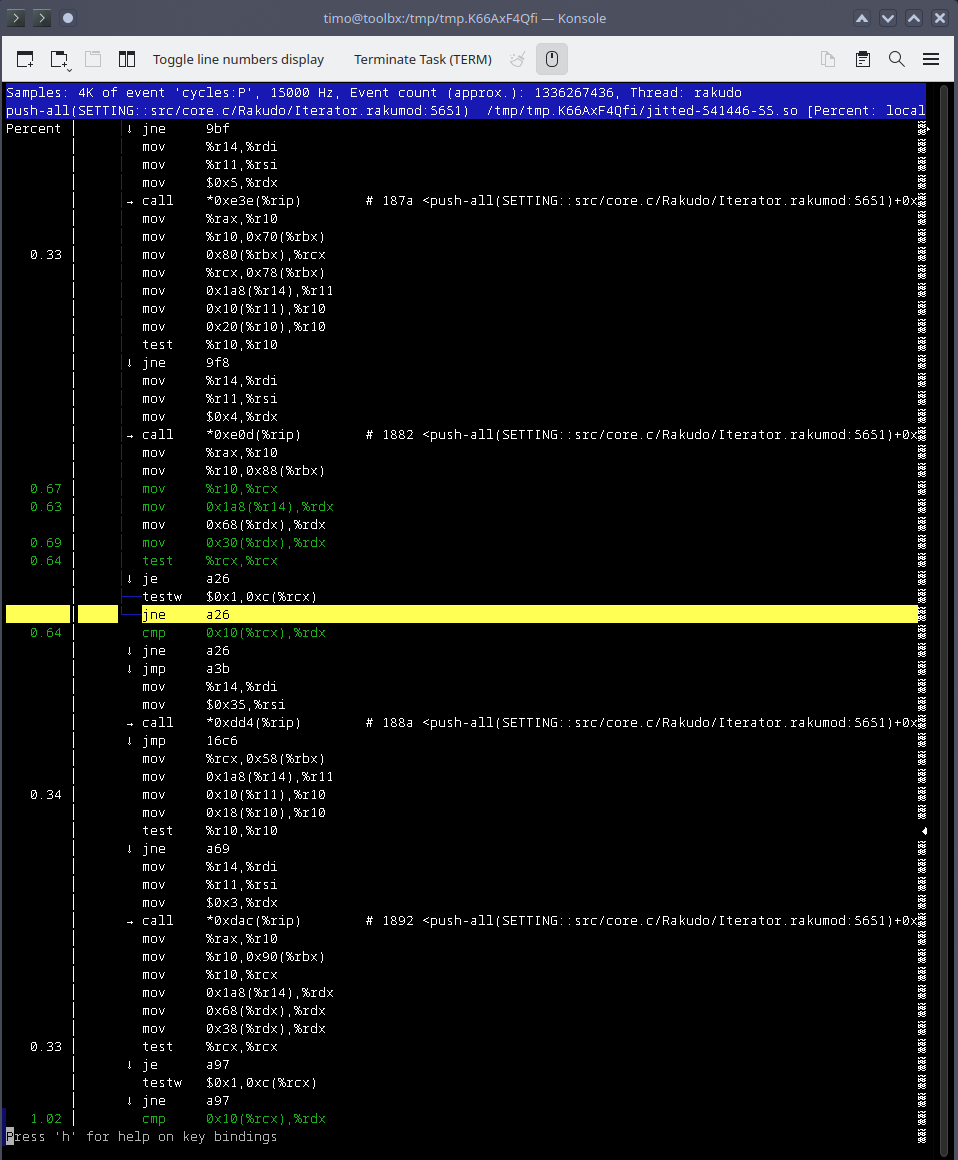
Of course, the recording and reporting options you know and love should all work: Higher frequency of sampling, sampling stack traces along with each event, recording with different events than just the CPU cycle counter, and so on.
If you read the JITDUMP specification yourself, you will have noticed that I didn't mention the support it has for unwinding information, nor the support for source line information. I actually didn't have a need for either of these yet. Presumably, if I created an output file with something like the spesh dump which has all the MoarVM bytecode ("disassembled") in the basic blocks and what-not, I could generate filename + line number pairs for all the instructions to place them at the exact right spot in the perf report output as well. I really need to look into what that might allow me to do, but for now I didn't have the time for it (but somehow I did have the time to write a good three thousand words about all of this? go figure.)
What I'm still missing
One utility that I haven't mentioned yet in this post is Valgrind, the dynamic instrumentation framework, which famously comes with the memcheck memory correctness checker and the cachegrind and callgrind performance profilers.
Valgrind offers a few "client requests" which let you tell the system helpful information about what your program is doing, for example when you have a custom allocator, you can tell valgrind what functions serve what function, and how memory "pools" and "pages" and such work in your implementation.
You can also manually mark memory as "this should not be written to", or "this must not be treated as a pointer".
Valgrind itself is way more than this. You can use it to write any kind of tool yourself that needs to run a program and at the same time make changes to the machine code that ends up executing on the CPU. This is what "instrumentation" refers to.
I just wanted to get correct function names and boundaries inside the output of callgrind / cachegrind (which can be visualized with kcachegrind), and ideally also a disassembly view of jitted functions, since that's where it can show you for every "outgoing" call instruction all the functions it ends up calling, and how often it hits each, and how much time is spent in which of the targets, etc.
Unfortunately, documentation for this part of the whole system is relatively sparse. I assume not many have had the same desire I had? Long ago I built a very naive attempt to post-process the callgrind or cachegrind output file and translate addresses if they fall into a jitted function's bounds to instead refer to a "function entry" as it were. Unfortunately, I couldn't get it to result in usable call graphs inside kcachegrind and I found it difficult to figure out where exactly to look for my mistake.
Conclusion
There's already a veritable plethora of APIs in this general space, some of which have overlap, some of which are for just one "platform", all of which leave me with something yet to be desired.
I sure wish there was a single solution that does everything I want and maybe even more!
yes, that is an XKCD reference. so sue me?
I'm sending this chunky blog post out into the world in the hopes that maybe someone out there is working on (or has already worked on) something that could help me with my blues, but even if not, I thought it was a good idea to get all my thoughts out and pull all of this into a single spot.
If you've made it through the whole post, thank you! I would love to hear your thoughts, so send them my way by finding me with the username timo on the libera.chat IRC network, or here on the fediverse where I occasionally post interesting things, but mostly just bad jokes and such?
They say that this blog has an RSS feed, which might just be getting en vogue again!